How To Build XAML Doughnut Chart?
WPF 및 Silverlight 용 Infragistics 패키지에는 데이터 시각화를 위한 다양한 차트가 포함되어 있습니다. 우리가 살펴볼 컨트롤은 도넛 차트.
이 차트는 빈 중심을 둘러싼 하나 이상의 고리를 지원합니다. 슬라이스, 레이블 및 색상을 제어하거나 내부 반경을 구성하여 사용자 지정할 수 있습니다. 이 블로그에서는 이 컨트롤을 애플리케이션에 추가하는 방법과 여러 링을 사용하여 사용자 지정 계층적 차트를 만드는 방법을 알아볼 수 있습니다.
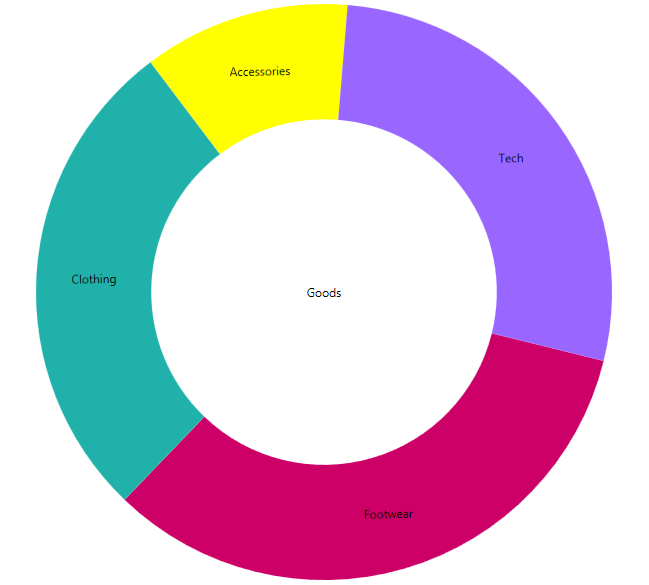
Adding the Doughnut Chart
일반적으로 WPF 프로젝트를 만들 때 가장 먼저 해야 할 일은 참조를 추가하는 것입니다. 그렇게 하는 쉬운 방법이 있습니다.
- 도구 상자로 이동합니다. 여기에서 NetAdvantage WPF 및 Shared XAML 컨트롤을 볼 수 있습니다.
- Drag and drop the “XamDoughnutChart”.
이러한 단계를 수행하면 Visual Studio에서 필요한 Infragistics 참조를 자동으로 추가하는 것을 볼 수 있습니다.

"XamDoughnutChart"를 드래그하면 실제로 차트를 호스팅하는 데 필요한 태그가 생성되었습니다. 다음 단계는 다음 코드를 포함하는 것입니다.
<ig:XamDoughnutChart x:Name="slice">
    <ig:XamDoughnutChart.Series>
        <ig:RingSeries
            LabelMemberPath="Label"
            ValueMemberPath="productionShare"
            LabelsPosition="BestFit"
            ItemsSource="{Binding Mode=OneWay, Source={StaticResource source}}">
        </ig:RingSeries>
    </ig:XamDoughnutChart.Series>
</ig:XamDoughnutChart>
항목에 대한 데이터 원본은 다음과 같이 페이지의 cs 파일에 생성됩니다.
public class Category
{
     public string Label { get; set; }
     public double productionShare { get; set; }
}

public class HierarchalDataCollection : List<Category>
{
     public HierarchalDataCollection()
     {
         this.Add(new Category { Label = "Footwear", productionShare = 46 });
         this.Add(new Category { Label = "Clothing", productionShare = 38 });
         this.Add(new Category { Label = "Accessories", productionShare = 16 });
     }
}
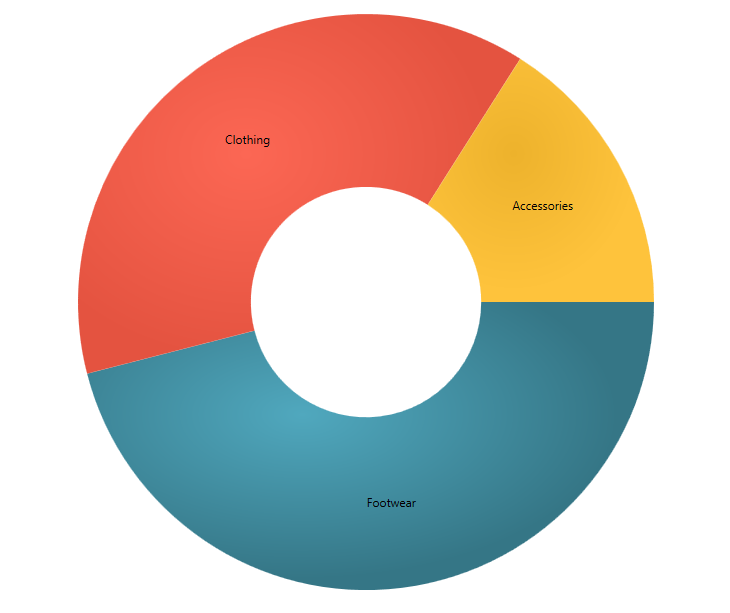
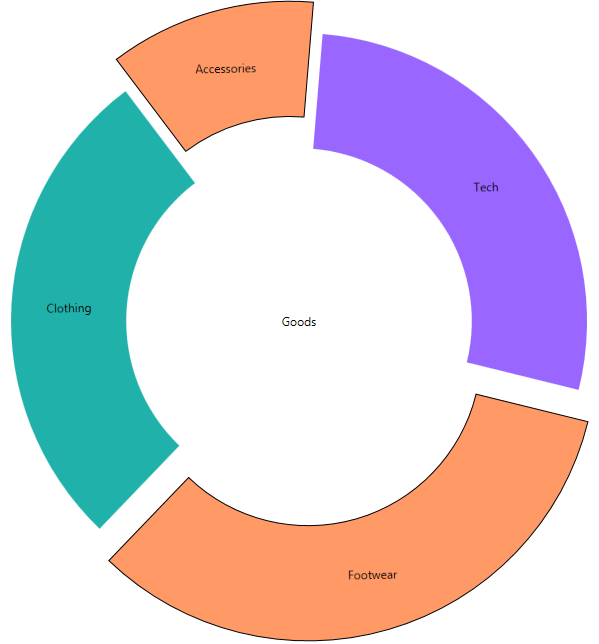
기본적으로 도넛 차트 만드는 단계입니다. 물론 범례, 브러시, 슬라이스 선택 및 슬라이스 폭발과 같은 많은 옵션이 있어 차트를 더욱 매력적으로 만들 수 있습니다. 설명서에서 찾을 수 있는 옵션에 대한 자세한 내용. 특정 옵션을 추가하는 방법에 대한 힌트를 드리겠습니다. 예를 들어, 조각을 선택하여 쪼개고 스타일을 변경하려면 AllowSliceExplosion 및 AllowSliceSelection 옵션을 추가하고 해당 값을 true로 설정합니다. 그런 다음 다음과 같이 슬라이스 클릭 이벤트를 만듭니다.
XAML:
AllowSliceExplosion="True"
AllowSliceSelection="True"
SliceClick="slice_SliceClick"
C#:
private void slice_SliceClick(object sender, Infragistics.Controls.Charts.SliceClickEventArgs e)
{
    e.IsSelected = !e.IsSelected;
    e.IsExploded = !e.IsExploded;
}
사용자 지정 계층적 차트
계층적 데이터를 시각화해야 하는 경우 차트의 다중 링 시각화를 사용할 수 있습니다. 우리는 세 개의 반지 도넛 차트를 만들 것입니다.이 차트는 주요 범주를 하위 범주로 분류하여 표시합니다. 이를 위해 세 개의 시리즈를 만들고 다음과 같이 데이터 소스를 정의할 것입니다.
XAML :
<ig:XamDoughnutChart.Series>
    <ig:RingSeries
	StartAngle="30"
        LabelMemberPath="Label"
        ValueMemberPath="productionShare"
        LabelsPosition="BestFit"
        ItemsSource="{Binding Mode=OneWay, Source={StaticResource source}}"
        Loaded="RingSeries_Loaded">
    </ig:RingSeries>
    <ig:RingSeries
        StartAngle="30"
        LabelMemberPath="Label"
        ValueMemberPath="productionShare"
        LabelsPosition="BestFit"
        Loaded="RingSeries_Loaded"
        OthersCategoryThreshold="0" >
    </ig:RingSeries>
    <ig:RingSeries
        StartAngle="30"
        LabelMemberPath="Label"
        ValueMemberPath="productionShare"
        LabelsPosition="BestFit"
        OthersCategoryThreshold="0">
    </ig:RingSeries>
</ig:XamDoughnutChart.Series>
C# :
public class HierarchalDataCollection : List<Category>
    {
        public HierarchalDataCollection()
        {

            this.Add(new Category { Label = "Footwear"});
            this.Add(new Category { Label = "Clothing"});
            this.Add(new Category { Label = "Accessories"});
            this.Add(new Category { Label = "Tech" });


            this[0].Children.Add(new Category { Label = "Boots" });
            this[0].Children.Add(new Category { Label = "Shoes" });
            this[0].Children.Add(new Category { Label = "Sneakers" });
            this[0].Children.Add(new Category { Label = "Slippers" });

            this[1].Children.Add(new Category { Label = "Dresses" });
            this[1].Children.Add(new Category { Label = "T-shirts" });
            this[1].Children.Add(new Category { Label = "Shirts" });
            this[1].Children.Add(new Category { Label = "Pants" });

            this[2].Children.Add(new Category { Label = "Bag" });
            this[2].Children.Add(new Category { Label = "Jewelry" });
            this[2].Children.Add(new Category { Label = "Scarf" });

            this[3].Children.Add(new Category { Label = "PC"});
            this[3].Children.Add(new Category { Label = "Laptops"});
            this[3].Children.Add(new Category { Label = "Tablets"});
            this[3].Children.Add(new Category { Label = "Phones"});


            this[0].Children[0].Children.Add(new Category { Label = "B1", productionShare = 3 });
            this[0].Children[0].Children.Add(new Category { Label = "B3", productionShare = 3 });
            this[0].Children[0].Children.Add(new Category { Label = "B4", productionShare = 4 });

            this[0].Children[1].Children.Add(new Category { Label = "S1", productionShare = 3 });
            this[0].Children[1].Children.Add(new Category { Label = "S2", productionShare = 5 });
            this[0].Children[1].Children.Add(new Category { Label = "S3", productionShare = 4 });

            this[0].Children[2].Children.Add(new Category { Label = "Sn1", productionShare = 6 });
            this[0].Children[2].Children.Add(new Category { Label = "Sn2", productionShare = 9 });

            this[0].Children[3].Children.Add(new Category { Label = "SL1", productionShare = 2 });
            this[0].Children[3].Children.Add(new Category { Label = "Sl2", productionShare = 4 });
            this[0].Children[3].Children.Add(new Category { Label = "Sl3", productionShare = 3 });


            this[1].Children[0].Children.Add(new Category { Label = "d1", productionShare = 3 });
            this[1].Children[0].Children.Add(new Category { Label = "d2", productionShare = 3 });
            this[1].Children[0].Children.Add(new Category { Label = "d3", productionShare = 2 });

            this[1].Children[1].Children.Add(new Category { Label = "t1", productionShare = 5 });
            this[1].Children[1].Children.Add(new Category { Label = "t2", productionShare = 4 });
            this[1].Children[1].Children.Add(new Category { Label = "t3", productionShare = 2 });
            this[1].Children[1].Children.Add(new Category { Label = "t4", productionShare = 1 });

            this[1].Children[2].Children.Add(new Category { Label = "sh1", productionShare = 3 });
            this[1].Children[2].Children.Add(new Category { Label = "sh2", productionShare = 3 });
            this[1].Children[2].Children.Add(new Category { Label = "sh3", productionShare = 2 });

            this[1].Children[3].Children.Add(new Category { Label = "p1", productionShare = 4 });
            this[1].Children[3].Children.Add(new Category { Label = "p2", productionShare = 6 });


            this[2].Children[0].Children.Add(new Category { Label = "bag1", productionShare = 2 });
            this[2].Children[0].Children.Add(new Category { Label = "bag2", productionShare = 1 });
            this[2].Children[0].Children.Add(new Category { Label = "bag3", productionShare = 4 });

            this[2].Children[1].Children.Add(new Category { Label = "j1", productionShare = 3 });
            this[2].Children[1].Children.Add(new Category { Label = "j2", productionShare = 2 });

            this[2].Children[2].Children.Add(new Category { Label = "sc1", productionShare = 1 });
            this[2].Children[2].Children.Add(new Category { Label = "sc2", productionShare = 1 });
            this[2].Children[2].Children.Add(new Category { Label = "sc3", productionShare = 1 });
            this[2].Children[2].Children.Add(new Category { Label = "sc4", productionShare = 1 });


            this[3].Children[0].Children.Add(new Category { Label = "pc1", productionShare = 3 });
            this[3].Children[0].Children.Add(new Category { Label = "pc2", productionShare = 2 });
            this[3].Children[0].Children.Add(new Category { Label = "pc3", productionShare = 5 });

            this[3].Children[1].Children.Add(new Category { Label = "l1", productionShare = 4 });
            this[3].Children[1].Children.Add(new Category { Label = "l2", productionShare = 3 });

            this[3].Children[2].Children.Add(new Category { Label = "tab1", productionShare = 4 });
            this[3].Children[2].Children.Add(new Category { Label = "tab2", productionShare = 3 });
            this[3].Children[2].Children.Add(new Category { Label = "tab3", productionShare = 3 });
            this[3].Children[2].Children.Add(new Category { Label = "tab4", productionShare = 3 });

            this[3].Children[3].Children.Add(new Category { Label = "ph1", productionShare = 2 });
            this[3].Children[3].Children.Add(new Category { Label = "ph2", productionShare = 3 });
            this[3].Children[3].Children.Add(new Category { Label = "ph3", productionShare = 2 });
            this[3].Children[3].Children.Add(new Category { Label = "ph4", productionShare = 1 });
        }
    }
이제 시각화하려는 모든 데이터가 준비되었습니다. 우리가 계층적으로 보이게 하기 때문에 모든 범주에 대한 다른 슬라이스가 비슷한 색상을 갖는다면 좋을 것입니다. 우리가 할 일은 가장 안쪽 링에서 기본 브러시를 가져와 모든 단계에서 가볍게 만드는 것입니다. 다음 코드에서는 먼저 반지에 몇 명의 자식이 있는지 파악한 다음 자식과 완벽하게 일치하는 브러시 컬렉션을 만드는 것을 볼 수 있습니다.
private void RingSeries_Loaded(object sender, RoutedEventArgs e)
{
    var ringSeries = (sender as RingSeries);
    var count = ringSeries.Ring.ArcItems[0].SliceItems.Count();
    var brushes = ringSeries.Brushes;
    BrushCollection brushesMatch = new BrushCollection();

    for (var i = 0; i < count; i++)
    {
        var childrenCount = (ringSeries.ItemsSource as List<Category>)[i].Children.Count();
        var child = (ringSeries.ItemsSource as List<Category>)[i].Children;

        var brush = brushes[i];

        for (var j = 0; j < childrenCount; j++)
        {
            double step = 1 / (double)childrenCount;
            Random rand = new Random();
                double val = (1 + j) * step - .3;

                brushesMatch.Add(brush.GetLightened(val));
        }
    }

    ringSeries.Chart.Series[ringSeries.Ring.Index + 1].Brushes = brushesMatch;
}
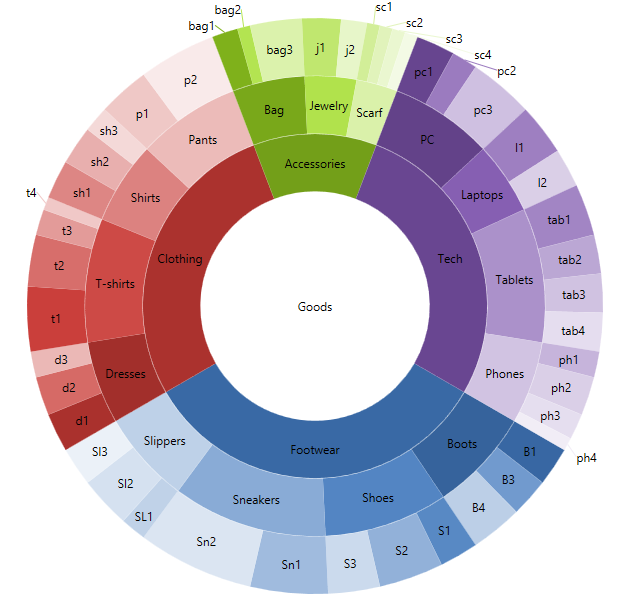
표시하려는 데이터에 따라 자식의 색상 방식을 변경할 수 있습니다(예: 임의의 색조로 브러시할 수 있음). 어떤 종류의 브러시를 사용하든 - Solid, Radial 또는 Linear Gradient GetLightend 확장 메소드가 처리합니다.
private void RingSeries_Loaded(object sender, RoutedEventArgs e)
{
    var ringSeries = (sender as RingSeries);
    var count = ringSeries.Ring.ArcItems[0].SliceItems.Count();
    var brushes = ringSeries.Brushes;
    BrushCollection brushesMatch = new BrushCollection();

    for (var i = 0; i < count; i++)
    {
        var childrenCount = (ringSeries.ItemsSource as List<Category>)[i].Children.Count();
        var child = (ringSeries.ItemsSource as List<Category>)[i].Children;

        var brush = brushes[i];

        for (var j = 0; j < childrenCount; j++)
        {
            Random rand = new Random();

            if (j % 2 == 0)
            {
                double val = Math.Round((rand.NextDouble() / 4), 2);
                brushesMatch.Add(brush.GetLightened(-val));
            }
            else
            {
                double val = Math.Round((rand.NextDouble() / 3), 2) + 0.2;
                brushesMatch.Add(brush.GetLightened(val));
            }
        }
    }

    ringSeries.Chart.Series[ringSeries.Ring.Index + 1].Brushes = brushesMatch;
}
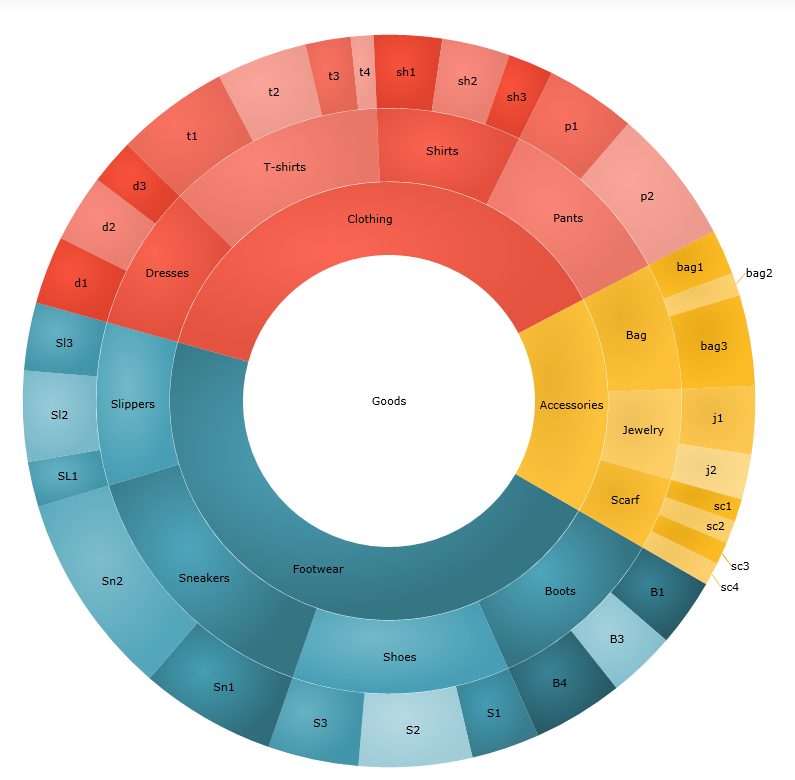
도넛 차트에 대해 자세히 알아보려면 제품 페이지를 확인하세요.
A WPF sample and Silverlight sample.
Twitter에서 팔로우할 수 있습니다.@ Infragistics그리고 계속 연락하세요페이스북,구글+그리고링크드인!