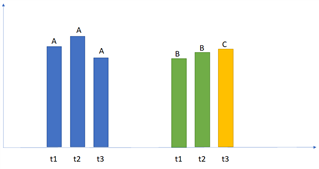
When using a XamDataChart with multiple column series and a CategoryXAxis, only one label can be displayed for each group of columns. I need one label for each column in the group, since the color of my colun are customized so it is hard for the user to distinguish which column belongs to which series. Below is an illustration of what I need when having three column series. Which items to compare is configured by the user, so there might be different items from the different timepoints, or the same item but at different timepoints and that is why I need this.