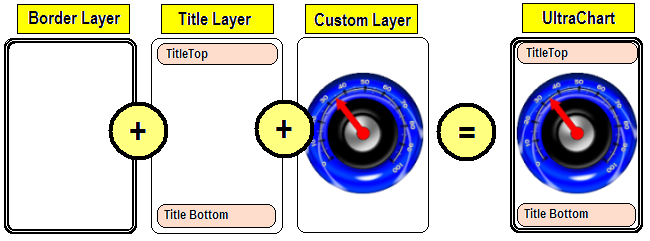
To add the custom layer to the chart’s layers collection, it must be added to the UltraChart.Layer Hash table and the UserLayerIndex , and then UltraChart.InvalidateLayers() must be called.
The Layer Hashtable is a key-and-value pairing of layer ID’s and layer objects. The UserLayerIndex is an ordering of Layer IDs. InvalidateLayers() causes Chart to pass key information to the layer objects (through the ILayer interface members) and redraw them.
The best place to do this at first is the Page_Load event, or whenever the chart is displayed for the first time.
There are three kinds of layers that make up the Chart control:
Standard Layers - These layers are rendered for every chart type. The Grid layer is changed depending upon the chart type to fit the requirements of selected chart type. Some chart types like PieChart, RadarChart and Doughnut chart do not have a grid layer.
Default Chart layer - This layer renders the chart data according to the Chart Type being drawn. For example, a Column chart’s Chart Layer renders rectangular objects with variable size and location according to the data source.
Custom Layer - External layer classes added by the application designer/developer.

UserLayerIndex is an array of strings that identifies the order the layers must be drawn on the chart. So, UserLayerIndex for the figure shown above will be:
In Visual Basic:
Me.UltraChart1.UserLayerIndex = New String() {"Default", "Custom Layer"}
In C#:
this.ultraChart1.UserLayerIndex = new string[] {"Default", "Custom Layer"};
"Default" must be included in the UserLayerIndex if the chart layer is to be drawn. Typically the chart layer is placed before any custom layers in the UserLayerIndex, however it could be placed after custom layers in order to render the chart layer after the custom layer is rendered.
There are some cases in which the developer should exclude the "Default" layer entirely. For example, there is the Gauge Layer, which excludes the chart layer and renders by itself, without any standard chart type.
The gauge chart is made up of only the following three layer types:
Border Layer - Border layer draws the border as shown
Title Layer - Titles are drawn in this layer.
Custom Layer - Gauge Layer.

The sample code below demonstrates how to add a custom layer.
In Visual Basic:
Private Sub Adding_Custom_Layers_Load(ByVal sender As System.Object, _
  ByVal e As System.EventArgs) Handles MyBase.Load
	' Create a gauge layer
	Dim gauge As New GaugeLayer()
	' Create is appearance
	gauge.Appearance = New GaugeAppearance()
	' Create and add a needle
	Dim needle As Needle = New Needle(0, New PaintElement(Color.Red))
	needle.PE.StrokeWidth = 18
	needle.Length = 75
	needle.PE.Fill = Color.Red
	gauge.Appearance.Needles.Add(needle)
	' Add this layer to chart
	Me.UltraChart1.Layer.Add("GaugeLayer", gauge)
	Me.UltraChart1.UserLayerIndex = New String() {"GaugeLayer"}
	Me.UltraChart1.ChartType = ChartType.PieChart
	Me.UltraChart1.InvalidateLayers()
End Sub
In C#:
private void Adding_Custom_Layers_Load(object sender, EventArgs e)
{
	// Create a gauge layer
	GaugeLayer gauge = new GaugeLayer();
	// Create is appearance
	gauge.Appearance = new GaugeAppearance();
	// Create and add a needle
	Needle needle = new Needle(0, new PaintElement(Color.Red));
	needle.PE.StrokeWidth = 18;
	needle.Length = 75;
	needle.PE.Fill = Color.Red;
	gauge.Appearance.Needles.Add(needle);
	// Add this layer to chart
	this.ultraChart1.Layer.Add("GaugeLayer", gauge);
	this.ultraChart1.UserLayerIndex = new string[] {"GaugeLayer"};
	this.ultraChart1.ChartType = ChartType.PieChart;
	this.ultraChart1.InvalidateLayers();
}