
This topic explains, with a code example, how to display marker values in the XamDataChart™ control.
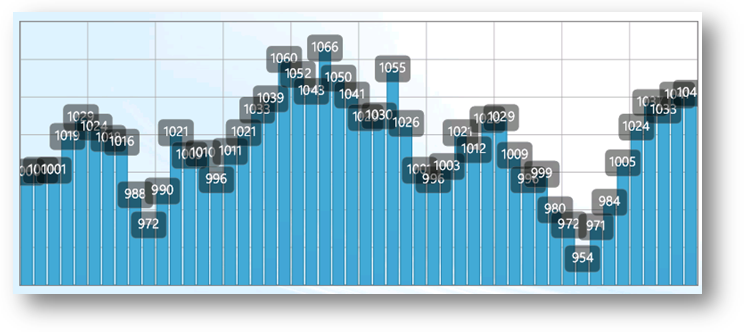
In the XamDataChart control, you can display the value of data points in the markers. (Figure 1) To do this, add a custom maker data template to the MarkerTemplate property of the Chart Series that inherit from MarkerSeries class.
Figure 1: A XamDataChart with a custom marker template displaying values of data points
The code snippet below demonstrates how to display values in the markers of the ColumnSeries.
In XAML:
<ig:XamDataChart x:Name="dataChart" >
    <ig:XamDataChart.Series>
        <ig:ColumnSeries ItemsSource="{Binding}"
                         ValueMemberPath="Value"
                         XAxis="{Binding ElementName=xAxis}"
                         YAxis="{Binding ElementName=yAxis}">
             <ig:ColumnSeries.MarkerTemplate>
                  <DataTemplate>
                      <Grid Width="40" Height="30" Margin="0,0,0,0">
                           <Border CornerRadius="5" Background="#72010101"
                                   BorderBrush="DimGray" BorderThickness="0.5">
                                   <!--Note: Text property of TextBlock is bound to
                                   property of items that make up the data source -->
                              <TextBlock Margin="2" Text="{Binding Item.Value}"
                                         Foreground="White" FontSize="15"
                                         HorizontalAlignment="Center" />
                           </Border>
                      </Grid>
                  </DataTemplate>
             </ig:ColumnSeries.MarkerTemplate>
        </ig:ColumnSeries >
    </ig:XamDataChart.Series>
</ig:XamDataChart>