<ig:XamOrgChart>
    <ig:XamOrgChart.NavigationSettings>
        <ig:NavigationSettings AllowPan="True" AllowZoom="True" />
    </ig:XamOrgChart.NavigationSettings>
</ig:XamOrgChart>This topic demonstrates how to configure the panning and zooming settings of the xamOrgChart™ control.
Panning and zooming are controlled by the following Boolean properties of the xamOrgChart control’s Navigation Settings:
The following code demonstrates how to allow both panning and zooming:
In XAML:
<ig:XamOrgChart>
<ig:XamOrgChart.NavigationSettings>
<ig:NavigationSettings AllowPan="True" AllowZoom="True" />
</ig:XamOrgChart.NavigationSettings>
</ig:XamOrgChart>In Visual Basic:
Dim orgChart As New XamOrgChart()
Dim navigationSettings As New NavigationSettings()
navigationSettings.AllowPan = True
navigationSettings.AllowZoom = True
orgChart.NavigationSettings = navigationSettings
In C#:
XamOrgChart orgChart = new XamOrgChart();
NavigationSettings navigationSettings = new NavigationSettings();
navigationSettings.AllowPan = true;
navigationSettings.AllowZoom = true;
orgChart.NavigationSettings = navigationSettings;
The zoom levels are controlled by the zoom level properties of the xamOrgChart control. For all these properties, the valid values are numbers greater than zero, including decimal fractions; the zoom level value multiplied by 100 produces the zoom scale in percentages, or, schematically speaking,
zoom level *100 = zoom %.
For example, a value of would 1 scale the nodes to 100%.
The zoom level properties of the xamOrgChart control are as follows:
Minimum Zoom Level –the minimum scale of the Org Chart’s content
Zoom Level – the current scale of the Org Chart’s content
Maximum Zoom Level – this is the maximum scale of the Org Chart’s content
The following code demonstrates configuring the zoom settings as follows:
maximum zoom level – 300%
minimum zoom level – 50%
current zoom level– 100%
In XAML:
<ig:XamOrgChart
    MaximumZoomLevel="3"
    MinimumZoomLevel="0.5"
    ZoomLevel="1">
</ig:XamOrgChart>
In Visual Basic:
Dim orgChart As New XamOrgChart()
orgChart.MaximumZoomLevel = 3
orgChart.MinimumZoomLevel = 0.5
orgChart.ZoomLevel = 1
In C#:
XamOrgChart orgChart = new XamOrgChart();
orgChart.MaximumZoomLevel = 3;
orgChart.MinimumZoomLevel = 0.5;
orgChart.ZoomLevel = 1;
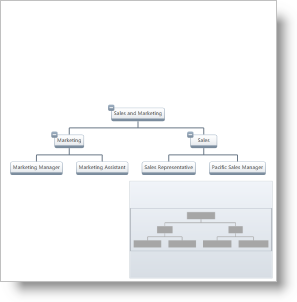
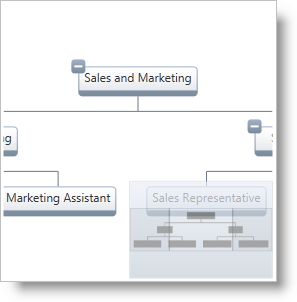
The code below demonstrates how to implement Scale-to-Fit and Zoom-to-100% features. The Scale to Fit feature scales the contents of xamOrgChart to fit the viewable area; Zoom to 100% scales the contents of the Org Chart to 100% (equivalent to ZoomLevel=1).

Figure 1: The Scale-to-Fit feature

Figure 2: The Zoom-to-100% feature
In Visual Basic:
Dim orgChart As New XamOrgChart()
orgChart.ScaleToFit()
orgChart.ZoomTo100()
‘Performs a 10% zoom in.
orgChart.ZoomIn()
‘Performs a 10% zoom out.
orgChart.ZoomOut()
In C#:
XamOrgChart orgChart = new XamOrgChart();
orgChart.ScaleToFit();
orgChart.ZoomTo100();
//Performs a 10% zoom in.
orgChart.ZoomIn();
//Performs a 10% zoom out.
orgChart.ZoomOut();