This topic explains, with code examples, how to create composite charts by plotting multiple types of Series in the same plot area of the XamDataChart™ control.
The topic is organized as follows:
The XamDataChart supports plotting unlimited number of Series in the same chart plot area. This is accomplished by adding the various types of Series objects to the XamDataChart control’s Series collection. Each series that is added to the chart must have a pair of appropriate types of Axis and data member mapping. For more information on this refer to the Series Requirements topic. In addition to support of plotting multiple series in any combination, some types of axes can be shared between various series (see Table 1) making composite charts a much easier process.
When plotting multiple series with different data sources, it is important to note that the chart will not align items of multiple data sources when plotting series with CategoryDateTimeXAxis or TimeXAxis. As a result, developers should align data items by inserting null items where one data source does not have corresponding items with another data source.
The following table shows types of axes supported by various series and which axes can be shared between different series in the Data Chart. Refer to the Examples section of this topic and to the Using Multiple Axes topic for more information on how to share axes.
This section provides a few examples of using multiple series in the XamDataChart control. Refer to topics for individual types of series for more information on data rendering rules.
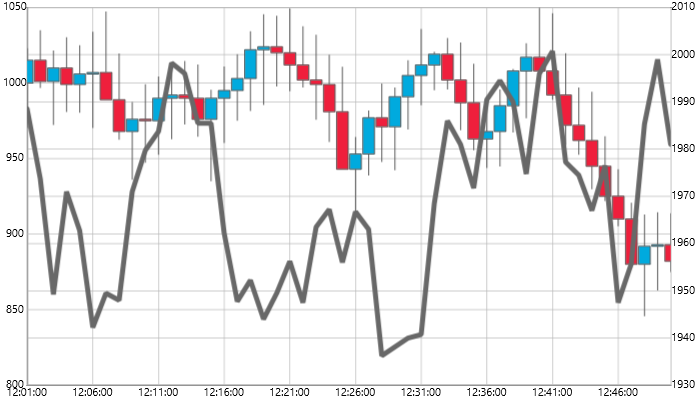
From the previous section, you learned that series can be mixed from different groups of series. An example of this is usage of the LineSeries type from the Category Series group and the FinancialPriceSeries type from the Financial Series group. In this example, the LineSeries will plot volume of stock market and the FinancialPriceSeries type will plot stock prices (open, high, low, and close) in the same chart plot area. In addition these two series will share x-axis in order to align data points horizontally. You can apply the same logic for plotting other types of series in any combinations you want as long as Series Requirements are met.

Figure 1 – Sample implementation of LineSeries and FinancialPriceSeries sharing the same x-axis.
In XAML:
xmlns:ig="clr-namespace:Infragistics.XamarinForms.Controls.Charts;assembly=Infragistics.XF.Charts"In XAML:
<ig:XamDataChart x:Name="DataChart" >
    <ig:XamDataChart.Axes>
        <ig:CategoryXAxis x:Name="sharedXAxis" ItemsSource="{Binding}" Label="Date" LabelLocation="OutsideBottom" />
        <ig:NumericYAxis x:Name="volumeYAxis" LabelLocation="OutsideRight" />
        <ig:NumericYAxis x:Name="priceYAxis" LabelLocation="OutsideLeft" />
    </ig:XamDataChart.Axes>
    <!-- ========================================================================== -->
    <ig:XamDataChart.Series>
        <ig:FinancialPriceSeries x:Name="priceSeries" Title="Stock Price"
                                 DisplayType="Candlestick"
                                 ItemsSource="{Binding}"
                                 OpenMemberPath="Open"
                                 CloseMemberPath="Close"
                                 HighMemberPath="High"
                                 LowMemberPath="Low"
                                 XAxis="{x:Reference sharedXAxis}"
                                 YAxis="{x:Reference priceYAxis}">
        </ig:FinancialPriceSeries>
        <ig:LineSeries x:Name="volumeSeries"
                       Title="Stock Volume"
                       ValueMemberPath="Volume" ItemsSource="{Binding}"
                       XAxis="{x:Reference sharedXAxis}"
                       YAxis="{x:Reference volumeYAxis}"
                       MarkerType="None"
                       Thickness="5" />
    </ig:XamDataChart.Series>
    <!-- ========================================================================== -->
</ig:XamDataChart>
In C#:
using Infragistics.XamarinForms.Controls.Charts;
...
var volumeYAxis = new NumericYAxis();
var priceYAxis = new NumericYAxis();
var sharedXAxis = new CategoryXAxis();

// set location for the axes
sharedXAxis.LabelLocation = AxisLabelsLocation.OutsideBottom;
volumeYAxis.LabelLocation = AxisLabelsLocation.OutsideRight;
priceYAxis.LabelLocation = AxisLabelsLocation.OutsideLeft;

// add created axes to the chart
this.DataChart.Axes.Add(volumeYAxis);
this.DataChart.Axes.Add(priceYAxis);
this.DataChart.Axes.Add(sharedXAxis);

// create a series for displaying stock volume
var volumeSeries = new LineSeries();
volumeSeries.ValueMemberPath = "Volume";
volumeSeries.XAxis = sharedXAxis;
volumeSeries.YAxis = volumeYAxis;

// create a series for displaying stock price values
var priceSeries = new FinancialPriceSeries();
priceSeries.HighMemberPath = "High";
priceSeries.LowMemberPath = "Low";
priceSeries.OpenMemberPath = "Open";
priceSeries.CloseMemberPath = "Close";
priceSeries.XAxis = sharedXAxis;
priceSeries.YAxis = priceYAxis;

// add created series to the chart
this.DataChart.Series.Add(priceSeries);
this.DataChart.Series.Add(volumeSeries);In the XamDataChart, multiple series that do not share the same x-axis are rendered on top of each other (figure 2). The first series in the Series collection of the XamDataChart control renders first and all successive series overlap the previous series. Therefore, it is recommended you use semi-transparent brushes for these series, cluster column series by sharing the same x-axis, or plot them in separate charts. In addition, adding a LineSeries to the chart that already has a ColumnSeries will render data points of the LineSeries in the middle of columns of the ColumnSeries (figure 3). This rendering rule also applies to all other non-column types of series (e.g. AreaSeries, SplneSeries etc.) when they are plotted with the ColumnSeries in the XamDataChart control.
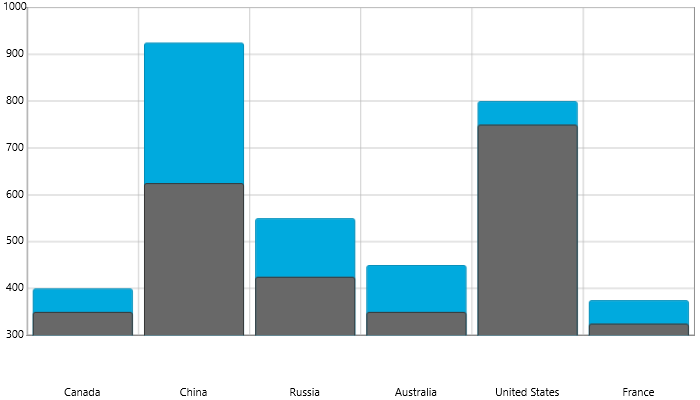
Figure 2 – Overlaid two ColumnSeries objects.
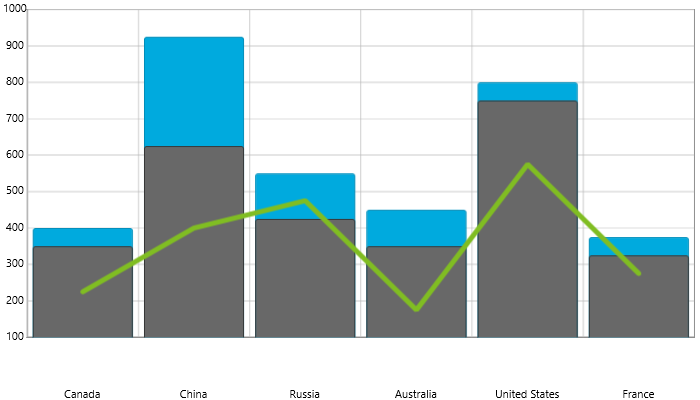
Figure 3 - Overlaid two ColumnSeries objects and one LineSeries object.
The following code example demonstrates plotting multiple overlaid ColumnSeries with a LineSeries.
In XAML:
<ig:XamDataChart x:Name="DataChart" >
    <ig:XamDataChart.Axes>
        <ig:CategoryXAxis x:Name="categoryXAxis1" ItemsSource="{Binding Data}" Label="Country"/>
        <ig:CategoryXAxis x:Name="categoryXAxis2" ItemsSource="{Binding Data}" Label="Country" LabelVisibility="Collapsed"/>
        <ig:NumericYAxis x:Name="sharedYAxis"/>
    </ig:XamDataChart.Axes>
    <!-- ========================================================================== -->
    <ig:XamDataChart.Series>
        <ig:ColumnSeries x:Name="columnSeries1"
                       ItemsSource="{Binding Data}"
                       ValueMemberPath="Coal"
                       Title="Column Series 1"
                       XAxis="{x:Reference categoryXAxis1}"
                       YAxis="{x:Reference sharedYAxis}">
        </ig:ColumnSeries>
        <ig:ColumnSeries x:Name="columnSeries2"
                       ItemsSource="{Binding Data}"
                       ValueMemberPath="Hydro"
                       Title="Column Series 2"
                       XAxis="{x:Reference categoryXAxis2}"
                       YAxis="{x:Reference sharedYAxis}">
        </ig:ColumnSeries>
        <ig:LineSeries x:Name="lineSeries"
                       Title="Line Series"
                       ValueMemberPath="Nuclear"
                       ItemsSource="{Binding Data}"
                       XAxis="{x:Reference categoryXAxis1}"
                       YAxis="{x:Reference sharedYAxis}"
                       MarkerType="None"
                       Thickness="5" />
    </ig:XamDataChart.Series>
    <!-- ========================================================================== -->
</ig:XamDataChart>
In C#:
using Infragistics.XamarinForms.Controls.Charts;
// ...
var sharedYAxis = new NumericYAxis();
var categoryXAxis1 = new CategoryXAxis();
var categoryXAxis2 = new CategoryXAxis();

// add created axes to the chart
this.DataChart.Axes.Add(categoryXAxis1);
this.DataChart.Axes.Add(categoryXAxis2);
this.DataChart.Axes.Add(sharedYAxis);

// create overlaid column series
var columnSeries1 = new ColumnSeries();
columnSeries1.ValueMemberPath = "Coal";
columnSeries1.XAxis = categoryXAxis1;
columnSeries1.YAxis = sharedYAxis;
var columnSeries2 = new ColumnSeries();
columnSeries2.ValueMemberPath = "Hydro";
columnSeries2.XAxis = categoryXAxis2;
columnSeries2.YAxis = sharedYAxis;

// create a line series
var lineSeries  = new LineSeries();
lineSeries.ValueMemberPath = "Nuclear";
lineSeries.XAxis = categoryXAxis1;
lineSeries.YAxis = sharedYAxis;

// add created series to the chart
this.DataChart.Series.Add(columnSeries1);
this.DataChart.Series.Add(columnSeries2);
this.DataChart.Series.Add(lineSeries);
Multiple column series that share the same x-axis are rendered in clusters where each cluster represents a data point (figure 4). The first series in the Series collection of the XamDataChart control renders as a column on the left of the cluster. Each successive series is rendered on the right of the previous series. However, adding the LineSeries type of series to clustered column series renders data points of the LineSeries in the center of the clusters (figure 5).
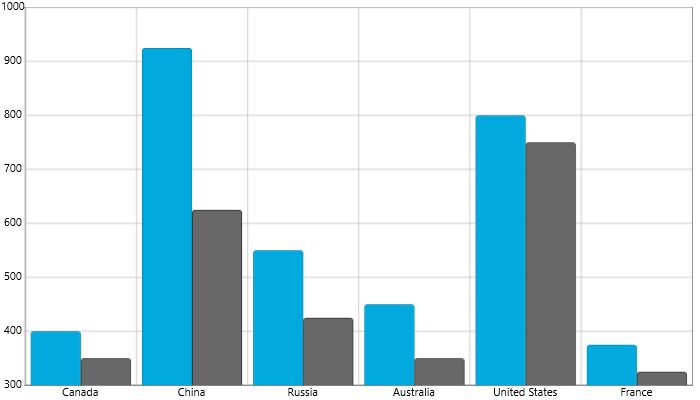
Figure 4 - Clustered two ColumnSeries objects
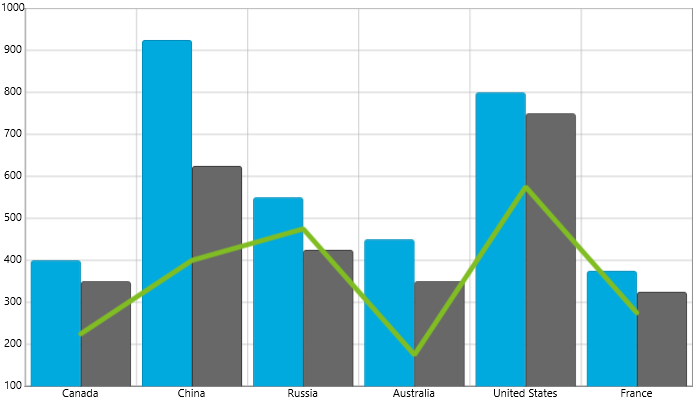
Figure 5 - Clustered two ColumnSeries objects with one LineSeries object
The following code example demonstrates plotting multiple clustered ColumnSeries with a LineSeries.
In XAML:
<ig:XamDataChart x:Name="DataChart" >
    <ig:XamDataChart.Axes>
        <ig:CategoryXAxis x:Name="sharedXAxis" ItemsSource="{Binding Data}" Label="Country"/>
        <ig:NumericYAxis x:Name="sharedYAxis"/>
    </ig:XamDataChart.Axes>
    <!-- ========================================================================== -->
    <ig:XamDataChart.Series>
        <ig:ColumnSeries x:Name="columnSeries1"
                       ItemsSource="{Binding Data}"
                       ValueMemberPath="Coal"
                       Title="Column Series 1"
                       XAxis="{x:Reference sharedXAxis}"
                       YAxis="{x:Reference sharedYAxis}">
        </ig:ColumnSeries>
        <ig:ColumnSeries x:Name="columnSeries2"
                       ItemsSource="{Binding Data}"
                       ValueMemberPath="Hydro"
                       Title="Column Series 2"
                       XAxis="{x:Reference sharedXAxis}"
                       YAxis="{x:Reference sharedYAxis}">
        </ig:ColumnSeries>
        <ig:LineSeries x:Name="lineSeries"
                       Title="Line Series"
                       ValueMemberPath="Nuclear"
                       ItemsSource="{Binding Data}"
                       XAxis="{x:Reference sharedXAxis}"
                       YAxis="{x:Reference sharedYAxis}"
                       MarkerType="None"
                       Thickness="5" />
    </ig:XamDataChart.Series>
    <!-- ========================================================================== -->
</ig:XamDataChart>
In C#:
using Infragistics.XamarinForms.Controls.Charts;
// ...
var sharedYAxis = new NumericYAxis();
var sharedXAxis = new CategoryXAxis();

// add created axes to the chart
this.DataChart.Axes.Add(sharedYAxis);
this.DataChart.Axes.Add(sharedXAxis);

// create clustered column series
var columnSeries1 = new ColumnSeries();
columnSeries1.ValueMemberPath = "Coal";
columnSeries1.XAxis = sharedXAxis;
columnSeries1.YAxis = sharedYAxis;
var columnSeries2 = new ColumnSeries();
columnSeries2.ValueMemberPath = "Hydro";
columnSeries2.XAxis = sharedXAxis;
columnSeries2.YAxis = sharedYAxis;

// create a line series
var lineSeries  = new LineSeries();
lineSeries.ValueMemberPath = "Nuclear";
lineSeries.XAxis = sharedXAxis;
lineSeries.YAxis = sharedYAxis;

// add created series to the chart
this.DataChart.Series.Add(columnSeries1);
this.DataChart.Series.Add(columnSeries2);
this.DataChart.Series.Add(lineSeries);