Version

Column Summaries

This topic will walk you through the process of implementing column summaries on the XamDataGrid control.

Required Background

Topic Purpose

Getting Started With XamDataGrid

This topic provides basic steps required for adding the XamDataGrid control to your view and populating it with sample data.

Overview

In some cases, your end users may be overwhelmed by the amount of data displayed in the and often they may be just looking for a summary of the data. Your end users may also want to derive additional information from the data of a specific column. Summaries help your end users achieve this.

Property Settings

You can enable summaries by setting the SummaryScope property to one of the following values of the DataSourceSummaryScope, which will determine the location of the summaries displayed:

  • Root - Summaries are only calculated at the root level.

  • Sections - Summaries are only calculated at the section level.

  • Both - Summaries are calculated for both the root and section level.

  • None - Summaries are not calculated at all.

The grid also supports five configurable summary locations inside groups using the GroupSummaryDisplayMode property:

  • List - Group summaries are displayed in a flat list in the spanning group header.

  • Cells - The group header is rendered as cells and summary values are rendered inside the cells aligned with their column. Note, when using summary cells if multiple summaries are set on a column only one summary will be displayed.

  • RowTop - Group summaries are displayed as summary rows at the top of the group.

  • RowBottom - Group summaries are displayed as summary rows at the bottom of the group.

  • None - No summaries are displayed in the group.

Column Summaries - Code Example

The following example shows how to group rows in the XamDataGrid control. This, and the following code example use the SampleSalesPerson data source.

In XAML:

xmlns:ig="clr-namespace:Infragistics.XamarinForms.Controls.Grids;assembly=Infragistics.XF.DataGrid"
...
<ig:XamDataGrid x:Name="DataGrid"
                   GroupHeaderDisplayMode="Combined"
                   SummaryScope="Both"
                   GroupSummaryDisplayMode="RowTop"
                   ItemsSource="{Binding}"
                   AutoGenerateColumns="False">
    <ig:XamDataGrid.Columns>
        <ig:NumericColumn HeaderText="Salary" Width="*" PropertyPath="Salary" FormatString="C" />
        <ig:NumericColumn HeaderText="Sales" PropertyPath="Sales" Width="*" FormatString="C" />
        <ig:TextColumn HeaderText="Name" PropertyPath="Name" HorizontalAlignment="Center"  Width="*" />
    </ig:XamDataGrid.Columns>
    <ig:XamDataGrid.SummaryDescriptions>
        <ig:ColumnSummaryDescription PropertyPath="Salary" ValueFormat="C" Operand="Average"/>
        <ig:ColumnSummaryDescription PropertyPath="Sales" ValueFormat="C" Operand="Max" />
        <ig:ColumnSummaryDescription PropertyPath="Sales" ValueFormat="C" Operand="Min" />
        <ig:ColumnSummaryDescription PropertyPath="Name" Operand="Count"/>
    </ig:XamDataGrid.SummaryDescriptions>
</ig:XamDataGrid>

In C#:

var salaryAvg = new ColumnSummaryDescription();
salaryAvg.PropertyPath = "Salary";
salaryAvg.Operand = SummaryOperand.Average;
salaryAvg.ValueFormat = "C";

var salesMax = new ColumnSummaryDescription();
salesMax.PropertyPath = "Sales";
salesMax.Operand = SummaryOperand.Max;
salesMax.ValueFormat = "C";

var salesMin = new ColumnSummaryDescription();
salesMin.PropertyPath = "Sales";
salesMin.Operand = SummaryOperand.Min;
salesMin.ValueFormat = "C";

var nameCount = new ColumnSummaryDescription();
nameCount.PropertyPath = "Name";
nameCount.Operand = SummaryOperand.Count;

this.DataGrid.SummaryDescriptions.Add(salaryAvg);
this.DataGrid.SummaryDescriptions.Add(salesMax);
this.DataGrid.SummaryDescriptions.Add(salesMin);
this.DataGrid.SummaryDescriptions.Add(nameCount);

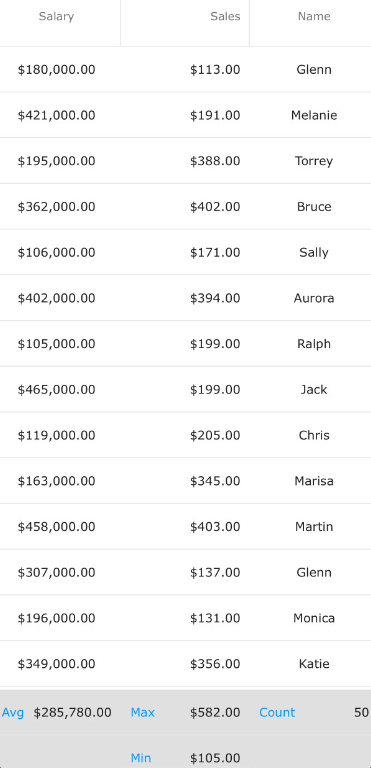
The above code snippets will result in a XamDataGrid that looks like the following:

datagrid-column-summaries.png

Custom Summaries - Code Example

In some situations, you may want to expand the default set of summaries, such as Count and Sum. For example, the number of times a particular value in a column appears.

The snippets below demonstrate how to display a Count for number of "USA" values appear in the column.

In C#:

var countries = new ColumnSummaryDescription();
countries.PropertyPath = "Countries";
countries.Operand = SummaryOperand.Custom;
countries.ProvideCalculator += Countries_ProvideCalculator;
this.DataGrid.SummaryDescriptions.Add(salaries);

private void Countries_ProvideCalculator(object sender, ProvideCalculatorEventArgs args)
{
    args.Calculator = new CustomDomestic();
}

class CustomDomestic : SummaryCalculator
    {
        public int countries;
        public override string DisplayName
        {
            get
            {
                return "USA";
            }
        }

        public override void BeginCalculation(IDataSource dataSource, string propertyName)
        {
            base.BeginCalculation(dataSource, propertyName);
            this.countries = 0;
        }

        public override void Aggregate(object item)
        {
            if(item = "USA")
            {
                this.countries++;
            }
        }

        public override ISummaryResult EndCalculation()
        {
            return new DefaultSummaryResult(
                this.PropertyName,
                SummaryOperand.Custom,
                this.countries);
        }
    }

Topic

Purpose

Row Pinning

This topic details, with code examples, how to configure row pinning in the XamDataGrid control.