Blazor 대시보드 타일
Blazor 대시보드 타일은 DataSource 컬렉션/배열 또는 단일 데이터 포인트를 분석하여 가장 적합한 시각화를 결정하는 자동 데이터 시각화 구성 요소입니다. 또한 다양한 방식으로 시각화를 변경할 수 있는 추가 도구 모음도 내장IgbToolbar 되어 있습니다.
범주 차트, 방사형 및 극좌표 차트, 분산형 차트, 지리 지도, 방사형 및 선형 게이지, 재무 차트 및 누적 차트를 포함하되 이에 국한되지 않는 제공된 데이터의 모양에 따라 다양한 시각화를 선택하여 표시할 수 있습니다.
도구 모음의 차트 유형 메뉴와 상호 작용하면 가능한 후보 목록에서 다른 시각화를 선택할 수 있습니다.
Blazor Dashboard Tile Example
Dependencies
Add the IgniteUI.Blazor.Controls namespace in the _Imports.razor file:
@using IgniteUI.Blazor.Controls
다음 모듈은 Dashboard Tile 구성 요소를 사용할 때 제안됩니다.
// in Program.cs file

builder.Services.AddIgniteUIBlazor(
    typeof(IgbDataChartDashboardTileModule),
    typeof(IgbRadialGaugeDashboardTileModule),
    typeof(IgbLinearGaugeDashboardTileModule),
    typeof(IgbGeographicMapDashboardTileModule),
    typeof(IgbPieChartDashboardTileModule),
    typeof(IgbDashboardTileModule)
);
Usage
대시보드 타일의DataSource 속성을 바인딩하는 방식에 따라 기본적으로 어떤 시각화가 보이는지가 결정됩니다. 컨트롤이 할당한 데이터를 평가한 후 Ignite UI for Blazor 도구 세트에서 시각화를 선택해 보여줍니다. 대시보드 타일에 표시될 데이터 시각화 컨트롤은 다음과 같습니다:
기본적으로 선택하는 데이터 시각화는 주로 스키마와 당신이 바인딩한 수의DataSource 수에 따라 달라집니다. 예를 들어, 하나의 숫자 값을 결합하면 aIgbRadialGauge가 나오지만, 서로 쉽게 구별할 수 있는 값-라벨 쌍들의 집합을 결합하면 aXamDataPieChart가 나올 가능성이 높습니다. 더 많은 값 경로를 가진 aDataSource를 결합하면, 주로 컬렉션 수에 따라 여러 열이나 선 연열을 가진 항목을 받게IgbDataChart 됩니다. 지리적 지점이 포함된 것으로 보이는 데이터나ShapeDataSource 데이터에 결합하여 aIgbGeographicMap를 받을 수도 있습니다.
를 묶DataSource을 때 단일 시각화에 묶이지 않으며, 컨트롤의 속성을 설정VisualizationType 해 특정 시각화를 보고 싶다고 지정할 수 있습니다. 예를 들어, 선도(line chart)를 보고 싶다면, 대시보드 타일을 다음과 같이 정의할 수 있습니다:
시각화의 속성이나 시각화 기능도 컨트롤 상단의 를IgbToolbar 통해 구성할 수 있습니다. 이 도구는IgbToolbar 현재 시각화의 기본 도구와 대시보드 타일 전용 네 가지 도구들이 추가되었으며, 아래에 강조되어 있습니다:
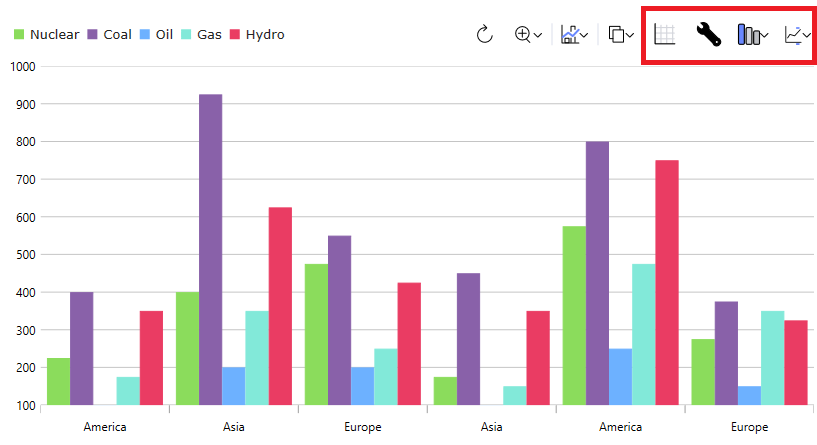
왼쪽에서 오른쪽으로:
- 첫 번째 도구는 제어 장치에 제공되는 데이터 그리드
DataSource를 보여줍니다. 이건 토글 도구라서, 그리드를 보여준 후 다시 클릭하면 시각화로 되돌아갑니다. - 두 번째 도구를 사용하면 현재 데이터 시각화의 설정을 구성할 수 있습니다.
- 세 번째 도구는 현재 시각화를 변경할 수 있게 해주어, 다른 시리즈 유형을 그래프로 그리거나 전혀 다른 유형의 시각화를 보여줄 수 있습니다. 이 기능은 위에서 언급한 속성을 설정
VisualizationType하여 컨트롤에 설정할 수 있습니다. - 마지막 도구는 기본 데이터 항목의 어떤 속성을 컨트롤에 포함할지 설정할 수 있게 해줍니다. 컨트롤에서 OR
IncludedProperties컬렉션을 설정ExcludedProperties하면 이 기능을 설정할 수 있습니다.
이 데모는 Blazor 파이 차트와 대시보드 타일 통합을 보여줍니다. 오른쪽 상단의 툴바 옵션은 스타일링 및 데이터 시각화 변경에 대한 액세스를 제공합니다.
이 데모에서는 대시보드 타일과 Blazor Geographic Map의 통합을 보여 줍니다. 오른쪽 위에 있는 도구 모음 옵션을 사용하면 데이터 시각화의 스타일을 지정하고 변경할 수 있습니다.
API References
IgbToolbarIgbCategoryChartIgbDataChartIgbDataPieChartIgbGeographicMapIgbLinearGaugeIgbRadialGauge